Preventing Message Loss in Amazon Kinesis + AWS Lambda Pipelines: Lessons from the Field
Event-driven architectures on AWS are powerful, but defaults can hide risks. This post shows how a Kinesis + Lambda pipeline lost messages, the root cause, the fix, and key practices like monitoring iterator age, DLQs, and batch size tuning.
As a Senior Cloud Architect at DoiT, I help customers troubleshoot critical event-driven architectures on AWS. One recent case involved the integration of Kinesis Data Streams and AWS Lambda, where critical application records are streamed, processed, and stored for analytics and compliance. One day, the customer noticed that far fewer records than usual appeared in the destination database.
At first glance, this looks like a straightforward architecture. In practice, however, the defaults can be misleading, and under the wrong conditions, messages can be lost. In this post, I’ll share how I analyzed the issue, what we discovered, and most importantly, how to detect and prevent similar problems before they impact production workloads.
The Architecture
The pipeline was simple:
- An application generates important records related to customer interactions.
- Those records are streamed into a Kinesis Data Stream.
- A Lambda function consumes records from Kinesis and forwarded results to a MySQL database by calling an ingestion API (using HTTP POST requests).
How Lambda consumes Kinesis streams
When a Lambda function is subscribed to a Kinesis stream, AWS automatically batches records from the stream and delivers them as an event to the function.
- By default, up to 100 records are passed per batch.
- The function must process all records successfully before the stream checkpoint advances.
- If the function fails, the entire batch is retried until it succeeds or until the data expires.
- Records in Kinesis have a limited retention period (24 hours by default, extendable to 7 days). If the consumer lags too far behind, data may expire before it is processed.
This design ensures at-least-once delivery, but it also means that inefficient consumers can cause backlogs, retries, and eventual data loss.
The Problem
One day, the customer noticed that far fewer records were processed than expected.
When data loss occurs in streaming pipelines, the first question is whether the stream itself is dropping records or if the consumer is falling behind. This meant checking key CloudWatch metrics such as:
WriteProvisionedThroughputExceededandReadProvisionedThroughputExceededto confirm the stream wasn’t throttling producers or consumers.IncomingRecordsandPutRecord.Successto verify records were being ingested as expected.GetRecords.SuccessandGetRecords.Latencyto see if reads were unusually slow.
All of these metrics showed normal behavior: records were arriving, throughput was well within shard limits, and no throttling was observed. That allowed us to rule out Kinesis as the bottleneck and focus on the consumer side.
So, while records were successfully written into Kinesis, the consumer Lambda couldn’t keep up.
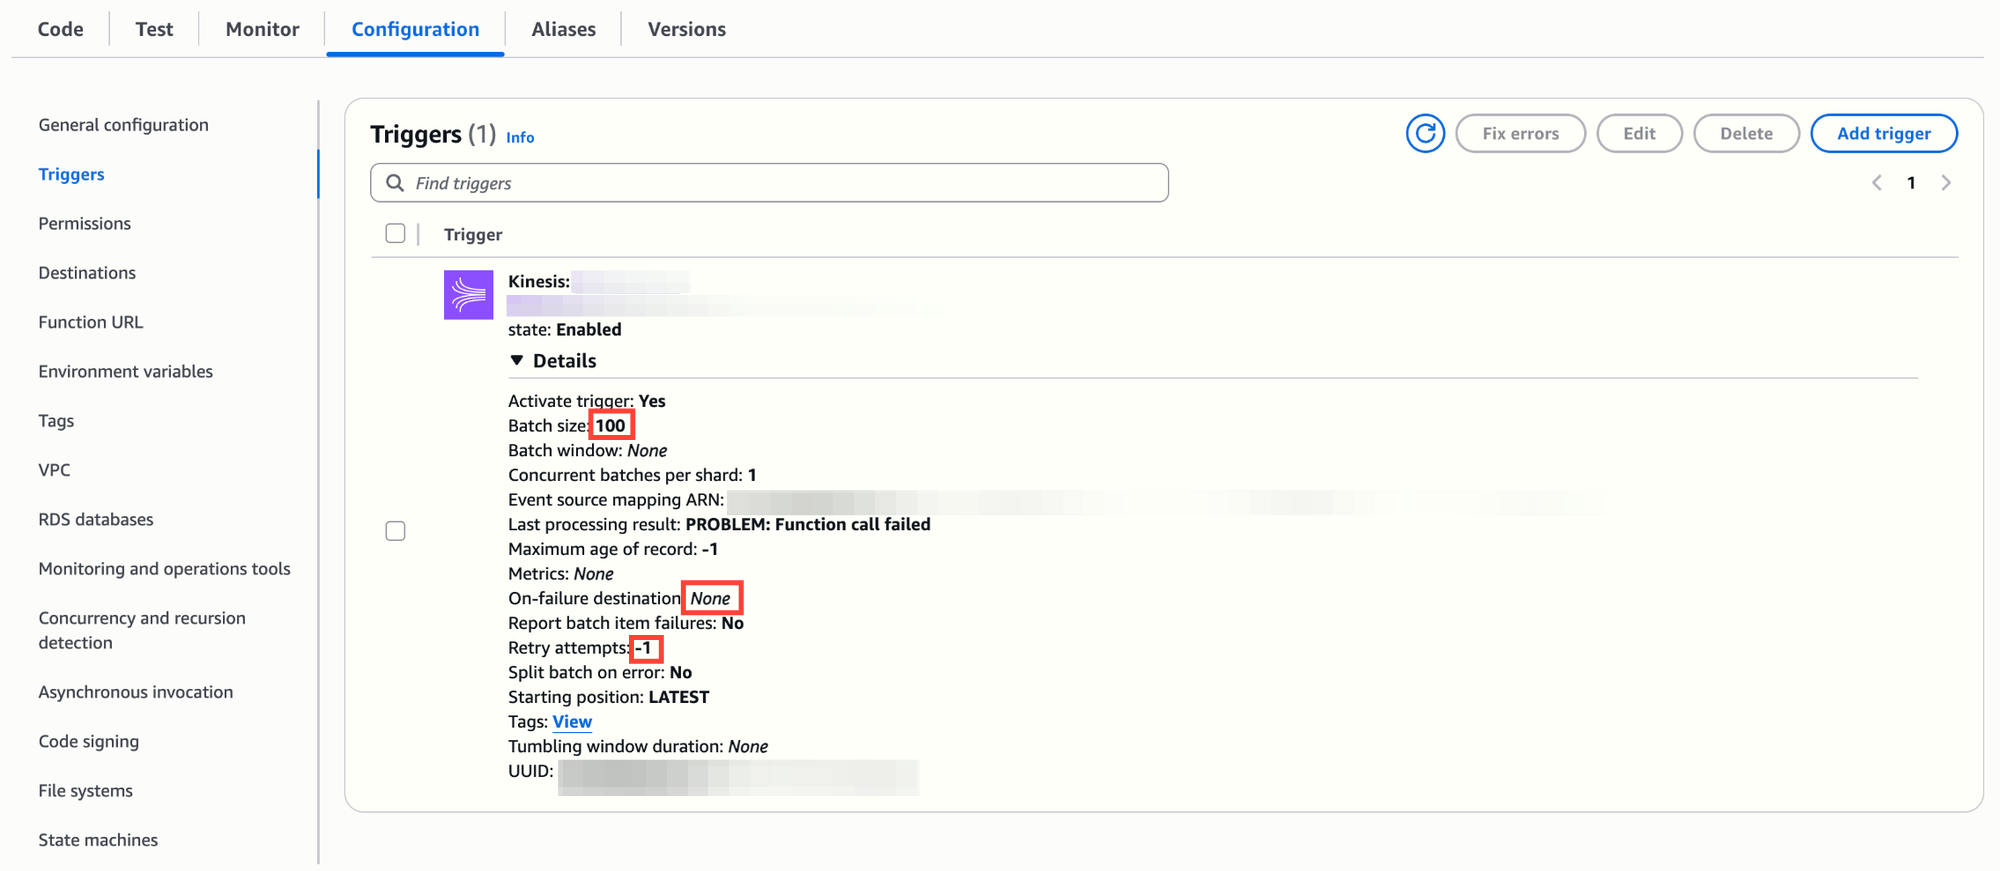
It was easy to identify that the issue was with the consumer Lambda function. The Lambda function had been reconfigured by mistake with these defaults:
- Timeout: 60 seconds.
- Memory: 128 MB.
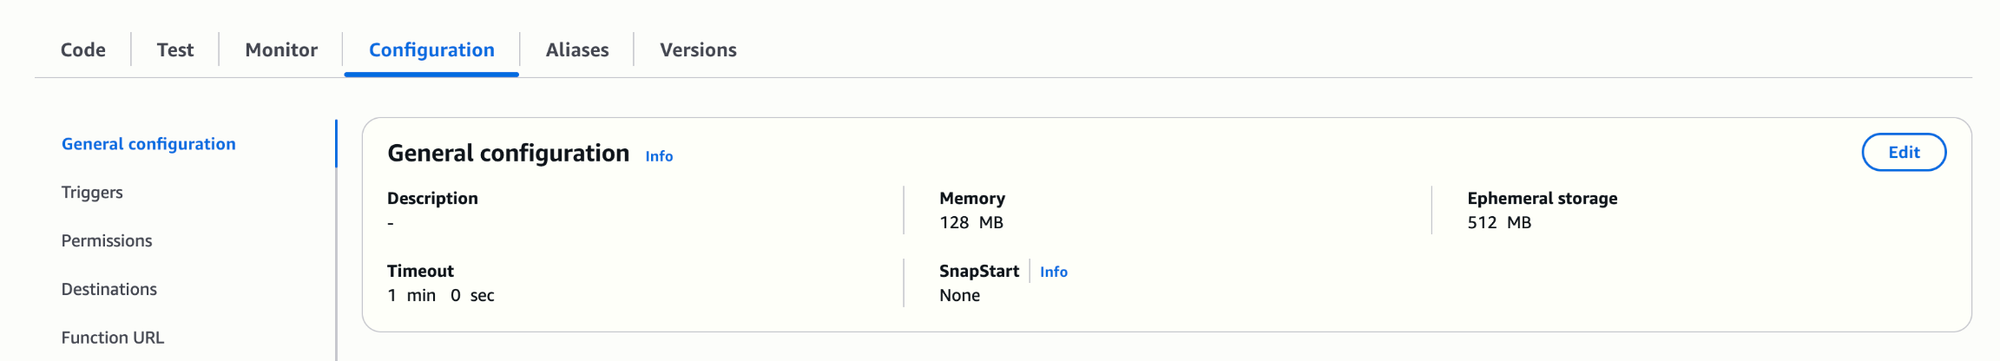
- Batch size: 100 records.
- Retry attempts: infinite.
The function logic was simple but inefficient:
- For each record in the batch, it was calling a blocking HTTP POST to an external endpoint.
- With ~600ms latency per call, 100 records meant ~60 seconds of sequential work.
- Any latency spike pushed processing beyond the 60-second timeout.
The result was a classic snowball effect:
- Timeouts caused entire batches to fail.
- With infinite retries, the same records were retried endlessly, consuming capacity but never making progress.
- The backlog grew as new data kept arriving.
- Eventually, older records expired in the stream before they could be processed, leading to permanent data loss.
The Fix
Once we identified the Lambda bottleneck, the following changes stabilized the pipeline:
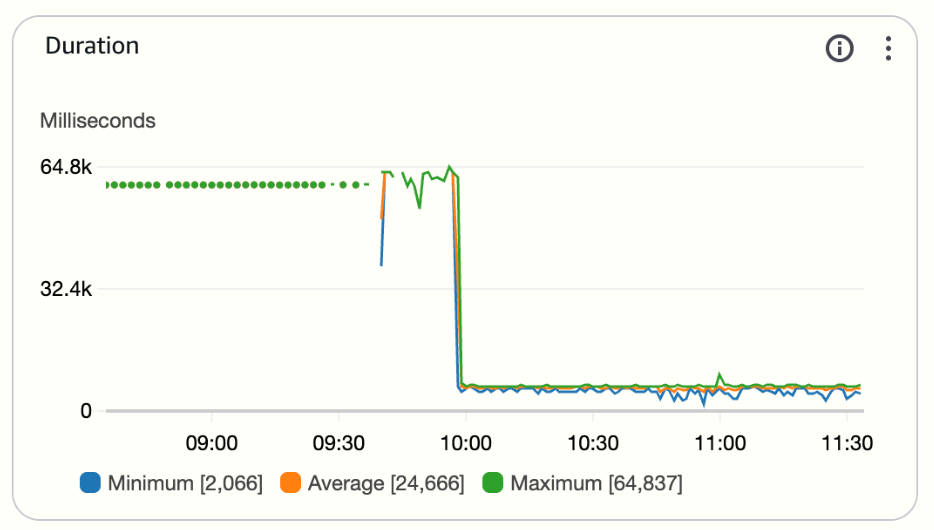
- Increase Timeout and Memory
- Timeout raised from 60s to 600s during testing, later tuned to 180s.
- Memory raised from 128 MB to 512 MB, increasing CPU and network throughput.
- Reduce Batch Size
- Lowered from 100 to 10, so each invocation handled fewer records.
- Smaller batches kept processing times predictable and under the timeout.
- Limit Retries
- Maximum Retry Attempts set to 2.
- This prevented infinite retry loops that worsened backlogs.
- Add a Dead Letter Queue (DLQ)
- Failed records were sent to SQS for inspection.
- This ensured visibility into problematic records instead of silent loss.
- Log HTTP Timing
- Wrapped POST requests with timers to measure latency.
- This helped confirm whether delays were due to Lambda configuration or the external API.
After these changes, the Lambda consistently processed all incoming records without falling behind.
What Could Have Prevented It
The fix was relatively simple once the root cause was understood. The more important lesson is that the pipeline could have been monitored and safeguarded from the beginning.
Key preventative measures include:
Monitoring & Alerts
- Monitor
IteratorAgeMilliseconds
This is the single most important Kinesis metric for consumers.
- It measures how far behind the consumer is from the tip of the stream.
- A rising iterator age indicates the consumer cannot keep up.
- Left unchecked, it leads to expired records and message loss.
Setting a CloudWatch alarm on this metric would have immediately signaled the issue.
For more details: Monitoring Kinesis with CloudWatch
- Monitor Lambda Error Metrics
Metrics such as Errors, Throttles, and Duration provide early warnings.
- Consistent timeouts or high error counts mean the function isn’t sized correctly.
- Duration close to the timeout limit signals that adjustments are needed.
Reliability & Safety Nets
- Use Dead Letter Queues (DLQs)
DLQs provide a safety net. Without them, failed records simply vanish.
With them, teams can:
- Capture failed records.
- Inspect payloads.
- Reprocess safely after fixing the root cause.
For more details: Using DLQs with Lambda
- Limit Retries
Infinite retries are rarely appropriate. They cause retry storms and prevent the system from making forward progress. Configuring retry limits ensures that stuck batches don’t block the entire pipeline.
Performance Tuning
- Right-Size Batch Size
Batch size should reflect both processing latency and downstream service capacity.
- For external APIs, smaller batch sizes reduce timeout risks.
- For internal, low-latency operations, larger batches may improve efficiency.
- Increase Lambda Memory
Memory allocation directly impacts CPU share in Lambda. Increasing memory often improves:
- JSON serialization/deserialization.
- HTTP request throughput.
- General runtime performance.
- Shard Appropriately
A single shard can quickly become a bottleneck. While one shard was sufficient in this case, multiple shards provide:
- Higher throughput.
- Parallel processing by multiple Lambda instances.
- Reduced risk of a single hot partition delaying processing.
Advanced Practices
For more complex pipelines, AWS also provides mechanisms like reporting batch item failures (so partial batches can succeed) and split-on-error handling to avoid retries blocking good records. These go beyond the basics but can further increase resilience in high-volume or high-variability workloads.
See the AWS documentation on batch item failures for details.
Best Practices Checklist
If you’re running Kinesis to Lambda pipelines, apply these today:
- Set a CloudWatch alarm on
IteratorAgeMilliseconds. - Use DLQs for all Kinesis consumers.
- Tune batch size and Lambda timeout.
- Increase Lambda memory to improve performance.
- Limit retries to avoid infinite loops.
- Consider decoupling with SQS for external API calls.
- Add alarms on Lambda error and duration metrics.
- Ensure your Kinesis stream has enough shards for your workload.
Conclusion
In this real-world case, Kinesis wasn’t the culprit; Lambda was. The defaults (60s timeout, 128 MB memory, batch size 100, infinite retries) made the consumer fragile. Under modest API latency, it failed to process records on time, leading to backlogs and eventual data loss.
The lesson is clear: Defaults are great for prototypes, but dangerous in production. Resilience in streaming pipelines doesn’t come from scaling alone. It comes from designing for backpressure, monitoring the right signals, and preparing for failure.
By monitoring iterator age, configuring DLQs, tuning batch sizes, and applying retry limits, you can avoid silent data loss and build confidence in your event-driven workloads.
As cloud architects, our job is not just to fix outages, but to design for resilience. With the right observability, fail-safes, and scaling strategies, customers can ensure that their most critical data pipelines deliver reliably, even under unpredictable conditions.