Sizing Your Savings Plans Commitment: AWS Target Coverage vs DoiT's Cost Curve Approach
AWS's new Savings Plans target coverage analysis lets you start with a coverage goal and work backward to a commitment amount. Here's a walkthrough of the feature, how it fits into a quarterly purchasing cadence, and how DoiT's Commitment Simulator and PerfectScale pick up where it leaves off.
AWS finally added the one feature FinOps teams have been asking for in the Savings Plans Purchase Analyzer: the ability to set a coverage target and get told exactly how much to buy to hit it. Here is a practical walkthrough of the new target coverage analysis, how it changes a quarterly purchasing cadence, and how DoiT's PerfectScale for Commitments picks up where it leaves off.
One of the most common FinOps conversations I have with customers at DoiT goes like this: finance says "we want 70% of our compute covered by commitments." The engineer opens the AWS Savings Plans console, sees a recommended hourly commitment, buys it, and a month later discovers coverage is sitting at 58% because the recommendation was optimized for savings rate, not for coverage percentage. The target and the tool were misaligned.
AWS addressed this gap on June 8, 2026, when the Savings Plans Purchase Analyzer added target coverage analysis. It sounds like a small quality-of-life update. In practice, it changes the entire purchase workflow for FinOps practitioners who are working to meet an organizational coverage commitment rather than simply chasing the highest discount percentage.
How the Savings Plans Purchase Analyzer Worked Before
The Savings Plans Purchase Analyzer has been available in AWS Billing and Cost Management for several years. The original workflow is straightforward: you open it in AWS Billing and Cost Management, choose a Savings Plans type (Compute, EC2 Instance, or SageMaker), pick a one-year or three-year term, select a payment option, and the tool returns a recommended hourly commitment based on a lookback period of your choice (7, 30, or 60 days).
The recommendation is calculated to maximize savings without over-committing. AWS uses a conservative algorithm: it models your usage, identifies the stable baseline, and recommends a commitment that covers that baseline while leaving variable peaks on On-Demand. The result is a high utilization rate on the plan you buy, but not necessarily the coverage rate your finance team cares about.
If your actual workload has grown since the lookback period, or if you are midway through a Savings Plans term and some plans are about to expire, the default recommendation gives you no direct way to answer the question: "How much do I need to buy to hit 75% coverage next quarter?"
What Target Coverage Analysis Changes
The new feature reframes the problem. Instead of asking "how much should I buy to maximize savings?" it asks "how much do I need to buy to hit a specific coverage percentage?"
To use it, navigate to Savings Plans, then Purchase Analyzer in the AWS Billing and Cost Management console. Select your Savings Plans type (Compute, Database, EC2 Instance, or SageMaker AI), analysis level, term, payment option, and lookback period. Under Commitment, choose Target coverage (%) and enter your desired percentage. Choose Run analysis.
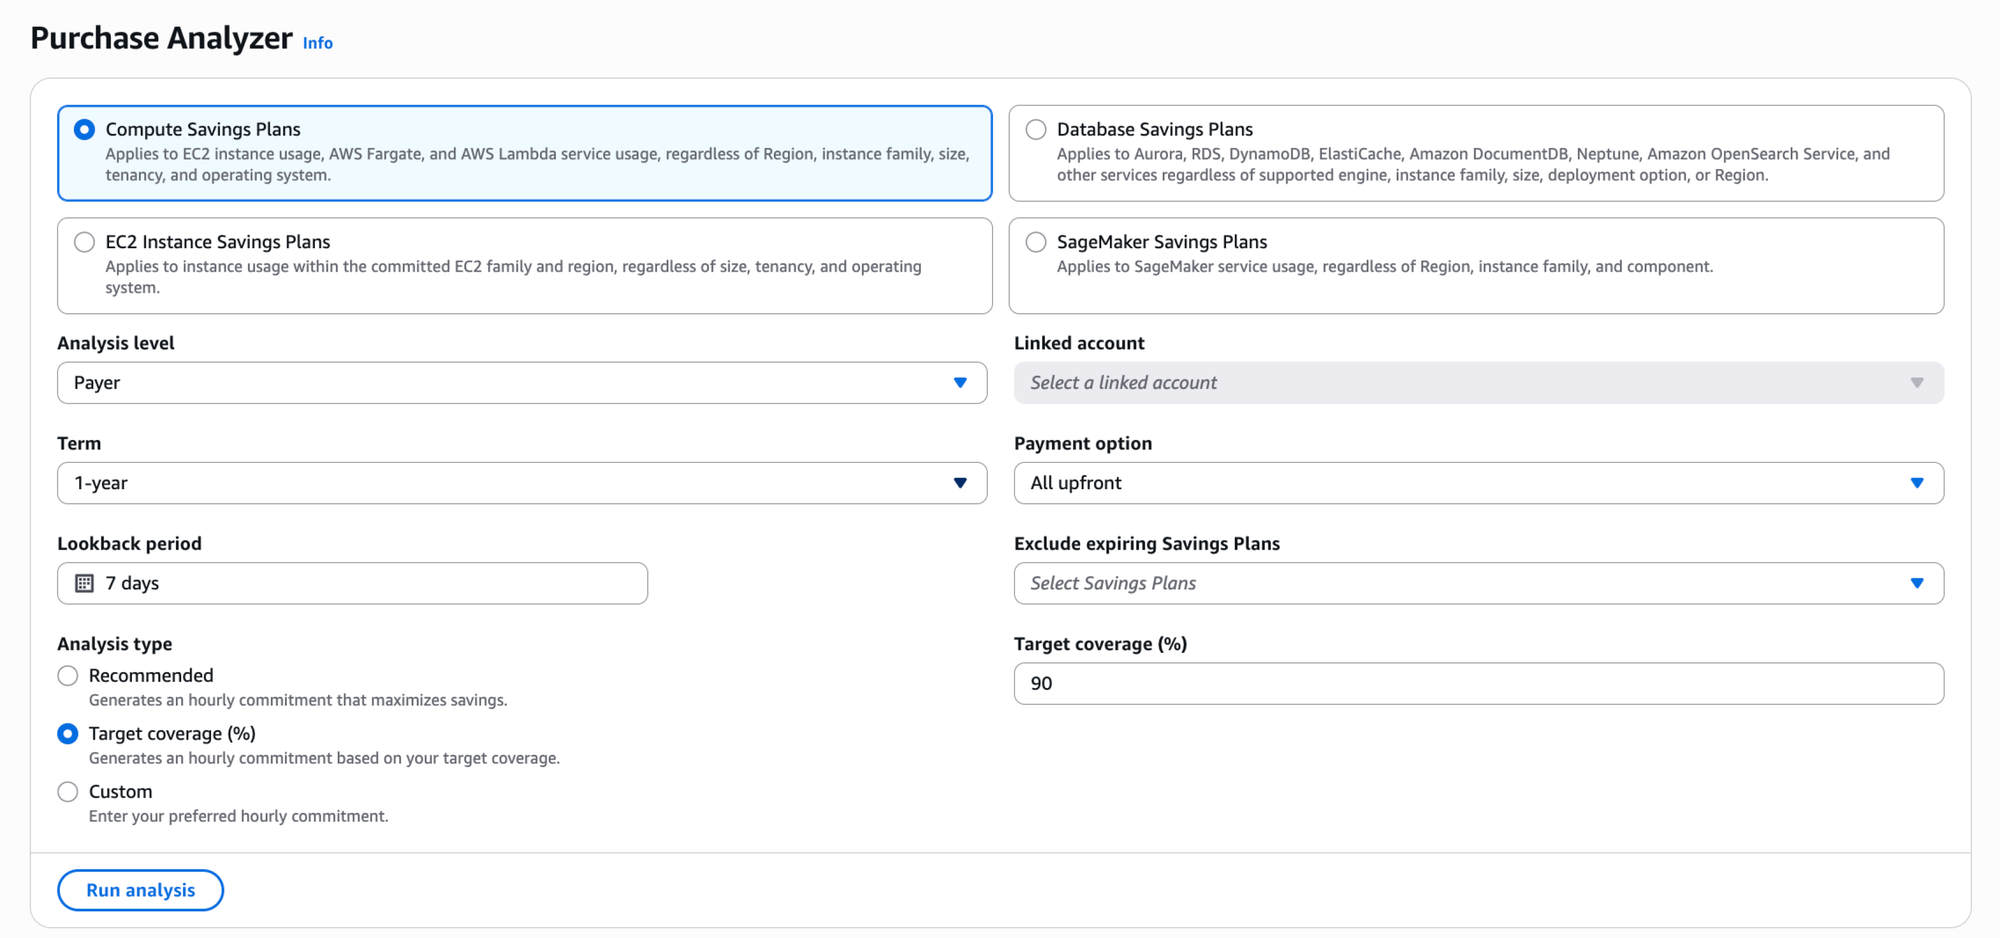
The analyzer applies the resulting Savings Plan to each hour of the historical lookback period, accounting for your usage composition across services and Regions, and your existing Savings Plans inventory (minus any you chose to exclude). The Analysis section presents three tabs: Cost, Coverage, and Utilization, with summary metrics showing estimated monthly savings, average hourly coverage increase, and average hourly utilization.
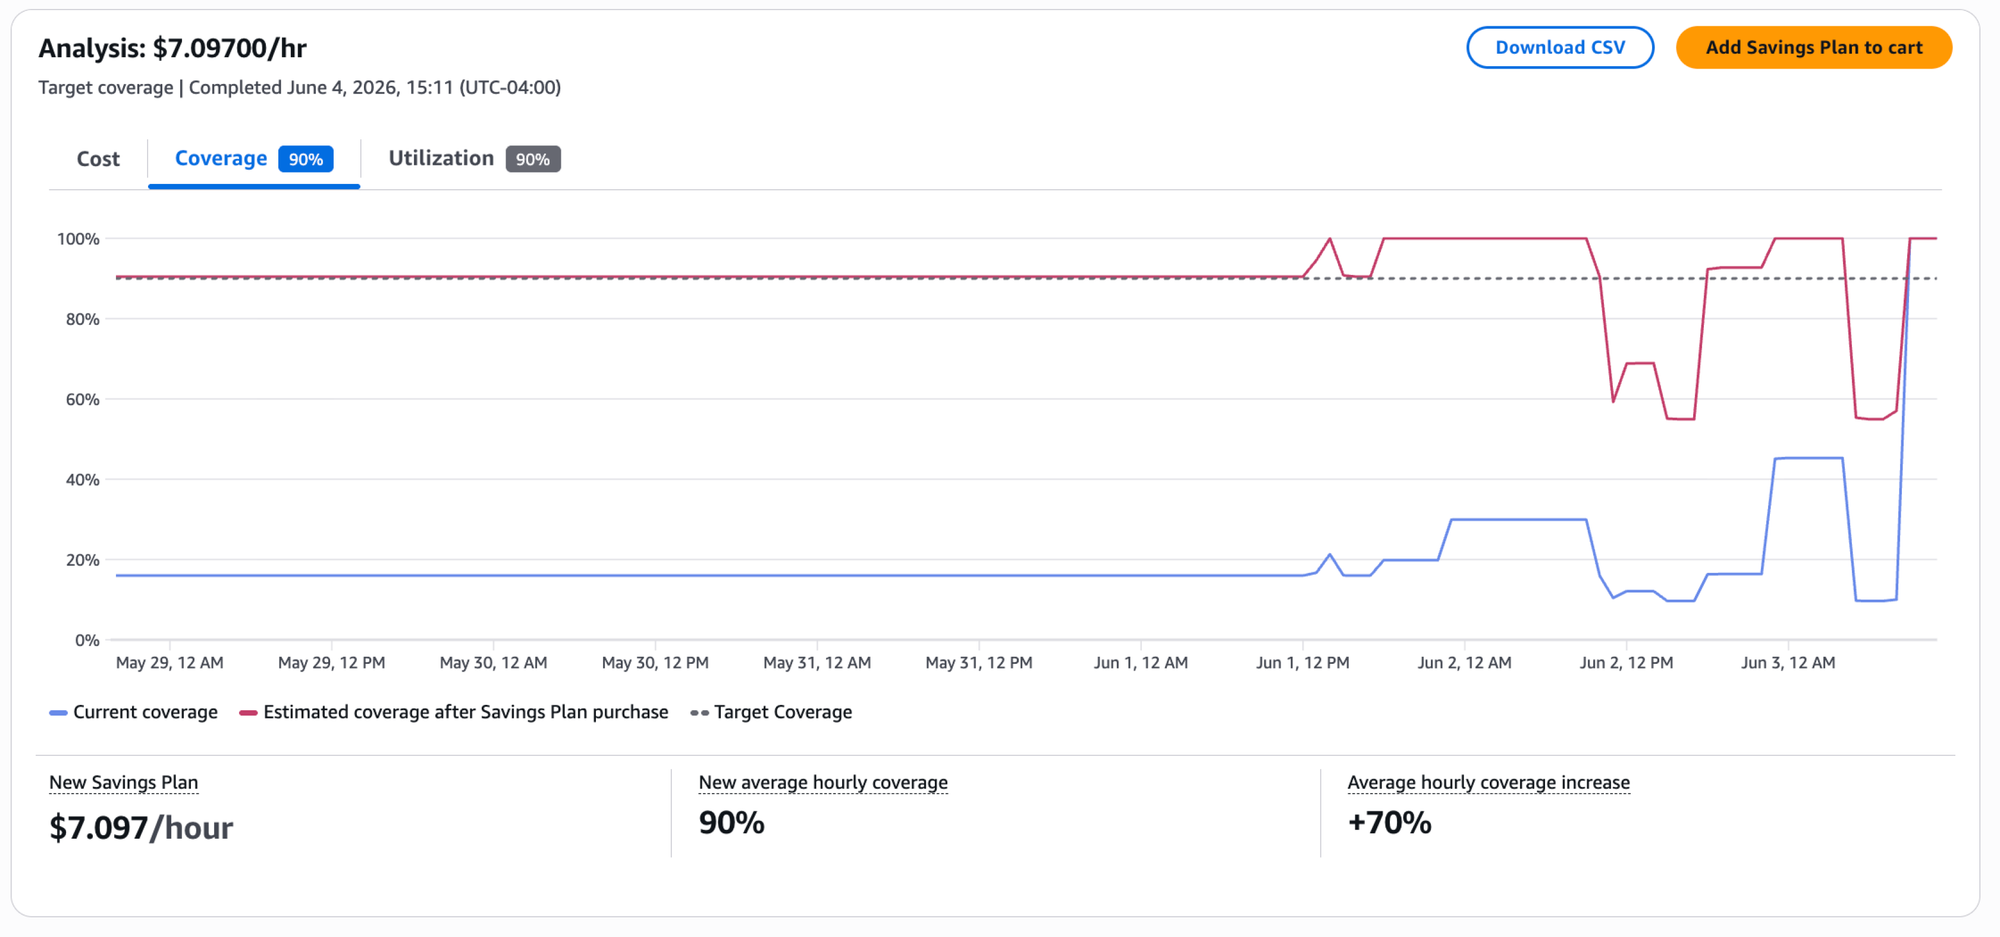
This is the core insight the feature exposes clearly for the first time: coverage and utilization are inversely related for variable workloads. You cannot simultaneously maximize both unless your usage is perfectly flat. Target coverage analysis lets you set the dial consciously rather than accepting whatever the default recommendation happens to produce.
NOTE: The analyses do not forecast your usage. They are based on historical usage over the selected lookback period. Be sure to select a lookback period that reflects your expected future usage. If you have recently migrated workloads or changed instance families, select a period after that change.
A Practical Walkthrough: Setting a 75% Coverage Target
Here is the workflow I would use with a customer who has a mixed EC2 and Fargate workload and a FinOps goal of 75% compute coverage.
Step 1: Baseline the current state. Before opening the analyzer, pull your current coverage from the Savings Plans Coverage report. Filter to the last 30 days and note your current average hourly coverage percentage and your average On-Demand spend.
aws ce get-savings-plans-coverage \
  --time-period Start=2026-05-01,End=2026-06-01 \
  --granularity MONTHLY \
  --filter '{"Dimensions": {"Key": "REGION", "Values": ["us-east-1"]}}' \
  --query 'SavingsPlansCoverages[*].{Coverage: Coverage.CoverageHours.CoverageHoursPercentage, Period: TimePeriod.Start}'
This gives you the starting line. If you are currently at 52% and you want 75%, you have a 23-point gap to close.
Step 2: Check for expiring plans. This step is critical and is one the default recommendation misses if you do not account for it manually. Open Savings Plans, then Inventory. Sort by expiration date. Note any plans expiring in the next 90 days and their hourly commitment amounts.
If you have a $4.20/hour Compute Savings Plan expiring in 45 days, simply buying enough new commitment to reach 75% will leave you below target the month after the old plan falls off. The target coverage analysis has a toggle labeled Exclude expiring Savings Plans that removes expiring plans from the coverage baseline, so the recommendation accounts for the gap they will leave.
Toggle it on. The recommended commitment will increase to cover not just the gap to 75%, but also the coverage that evaporates when the expiring plan drops off.
Step 3: Model the commitment. Under Commitment, choose Target coverage (%) and enter 75%. Run the analysis. Note the recommended hourly commitment. Switch to the Utilization tab and note the projected utilization. If projected utilization falls below 85%, the commitment is aggressive relative to your stable baseline. Consider whether your workload trajectory justifies it, or whether 70% coverage with higher utilization is a better tradeoff for now.
Step 4: Compare to the default recommendation. Before clicking Add Savings Plan to cart, do a side-by-side comparison. Run the analysis again with Commitment set to Recommended, and record the default recommended commitment. The difference between the two numbers is the incremental amount you are paying for the additional coverage percentage. Calculate that delta as a percentage of your monthly On-Demand spend. This is the cost of the coverage guarantee.
In a typical mid-size environment with $80,000/month of On-Demand compute, the difference between a "maximize savings" recommendation and a "75% coverage" recommendation is often $300 to $800 per month in incremental commitment, with a projected utilization drop of 5 to 8 points. Whether that tradeoff is worth it depends entirely on your organization's FinOps policy.
Step 5: Build the purchasing cadence. One-time purchases are not a strategy. A healthy commitment posture involves staggered purchases over time, so no single renewal cliff exposes you to a sudden coverage drop. The target coverage analysis supports this by letting you model partial purchases: instead of buying the full recommended amount at once, buy half this quarter and plan the second half for next quarter after validating that usage held.
Where DoiT's Commitment Simulator Takes a Different Approach
The AWS Purchase Analyzer and DoiT's Commitment Simulator solve the same problem from different angles. Understanding the difference helps you decide which to use (or both).
AWS Purchase Analyzer asks: "Given a target (coverage %, recommended, or custom amount), what would my savings, coverage, and utilization have looked like?" It starts from a goal you provide and works backward to a commitment amount.
DoiT Commitment Simulator asks: "What is the commitment amount that would have minimized my total cost?" It simulates every possible commitment from $0/hr upward in $0.10 increments against a full month of billing data, categorizing every dollar into three buckets: SP Covered (discounted), SP Uncovered (on-demand), and SP Wasted (unused commitment). The result is an interactive cost curve that shows exactly where savings peak and where overcommitment begins.
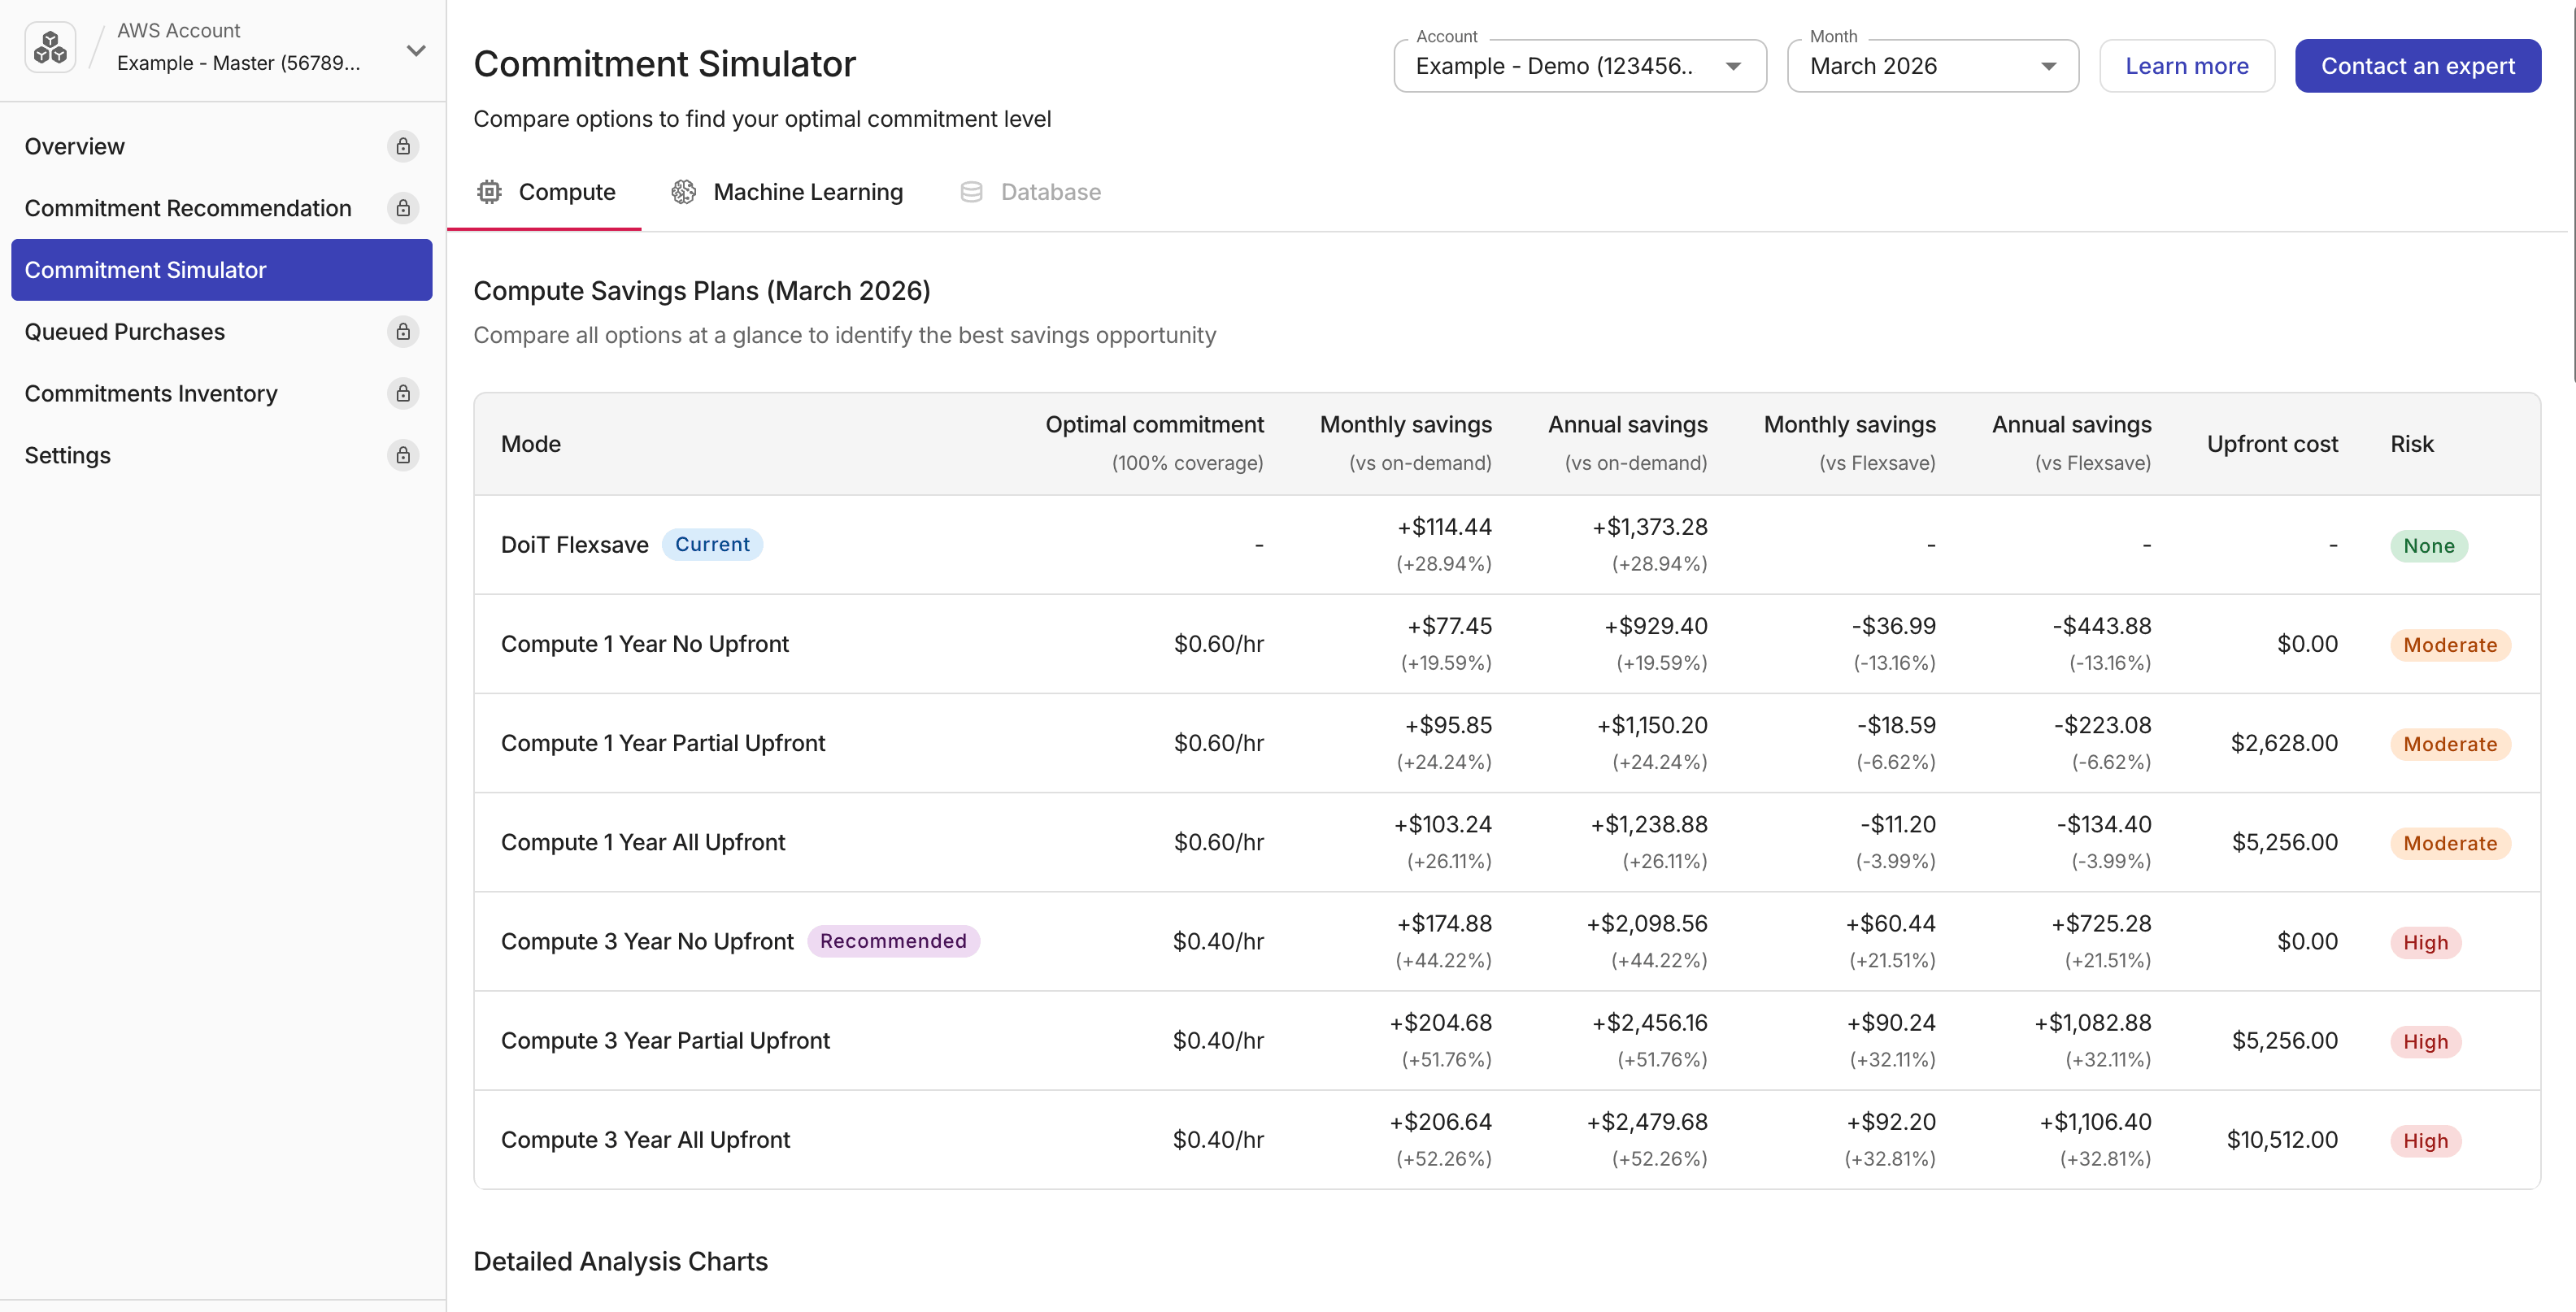
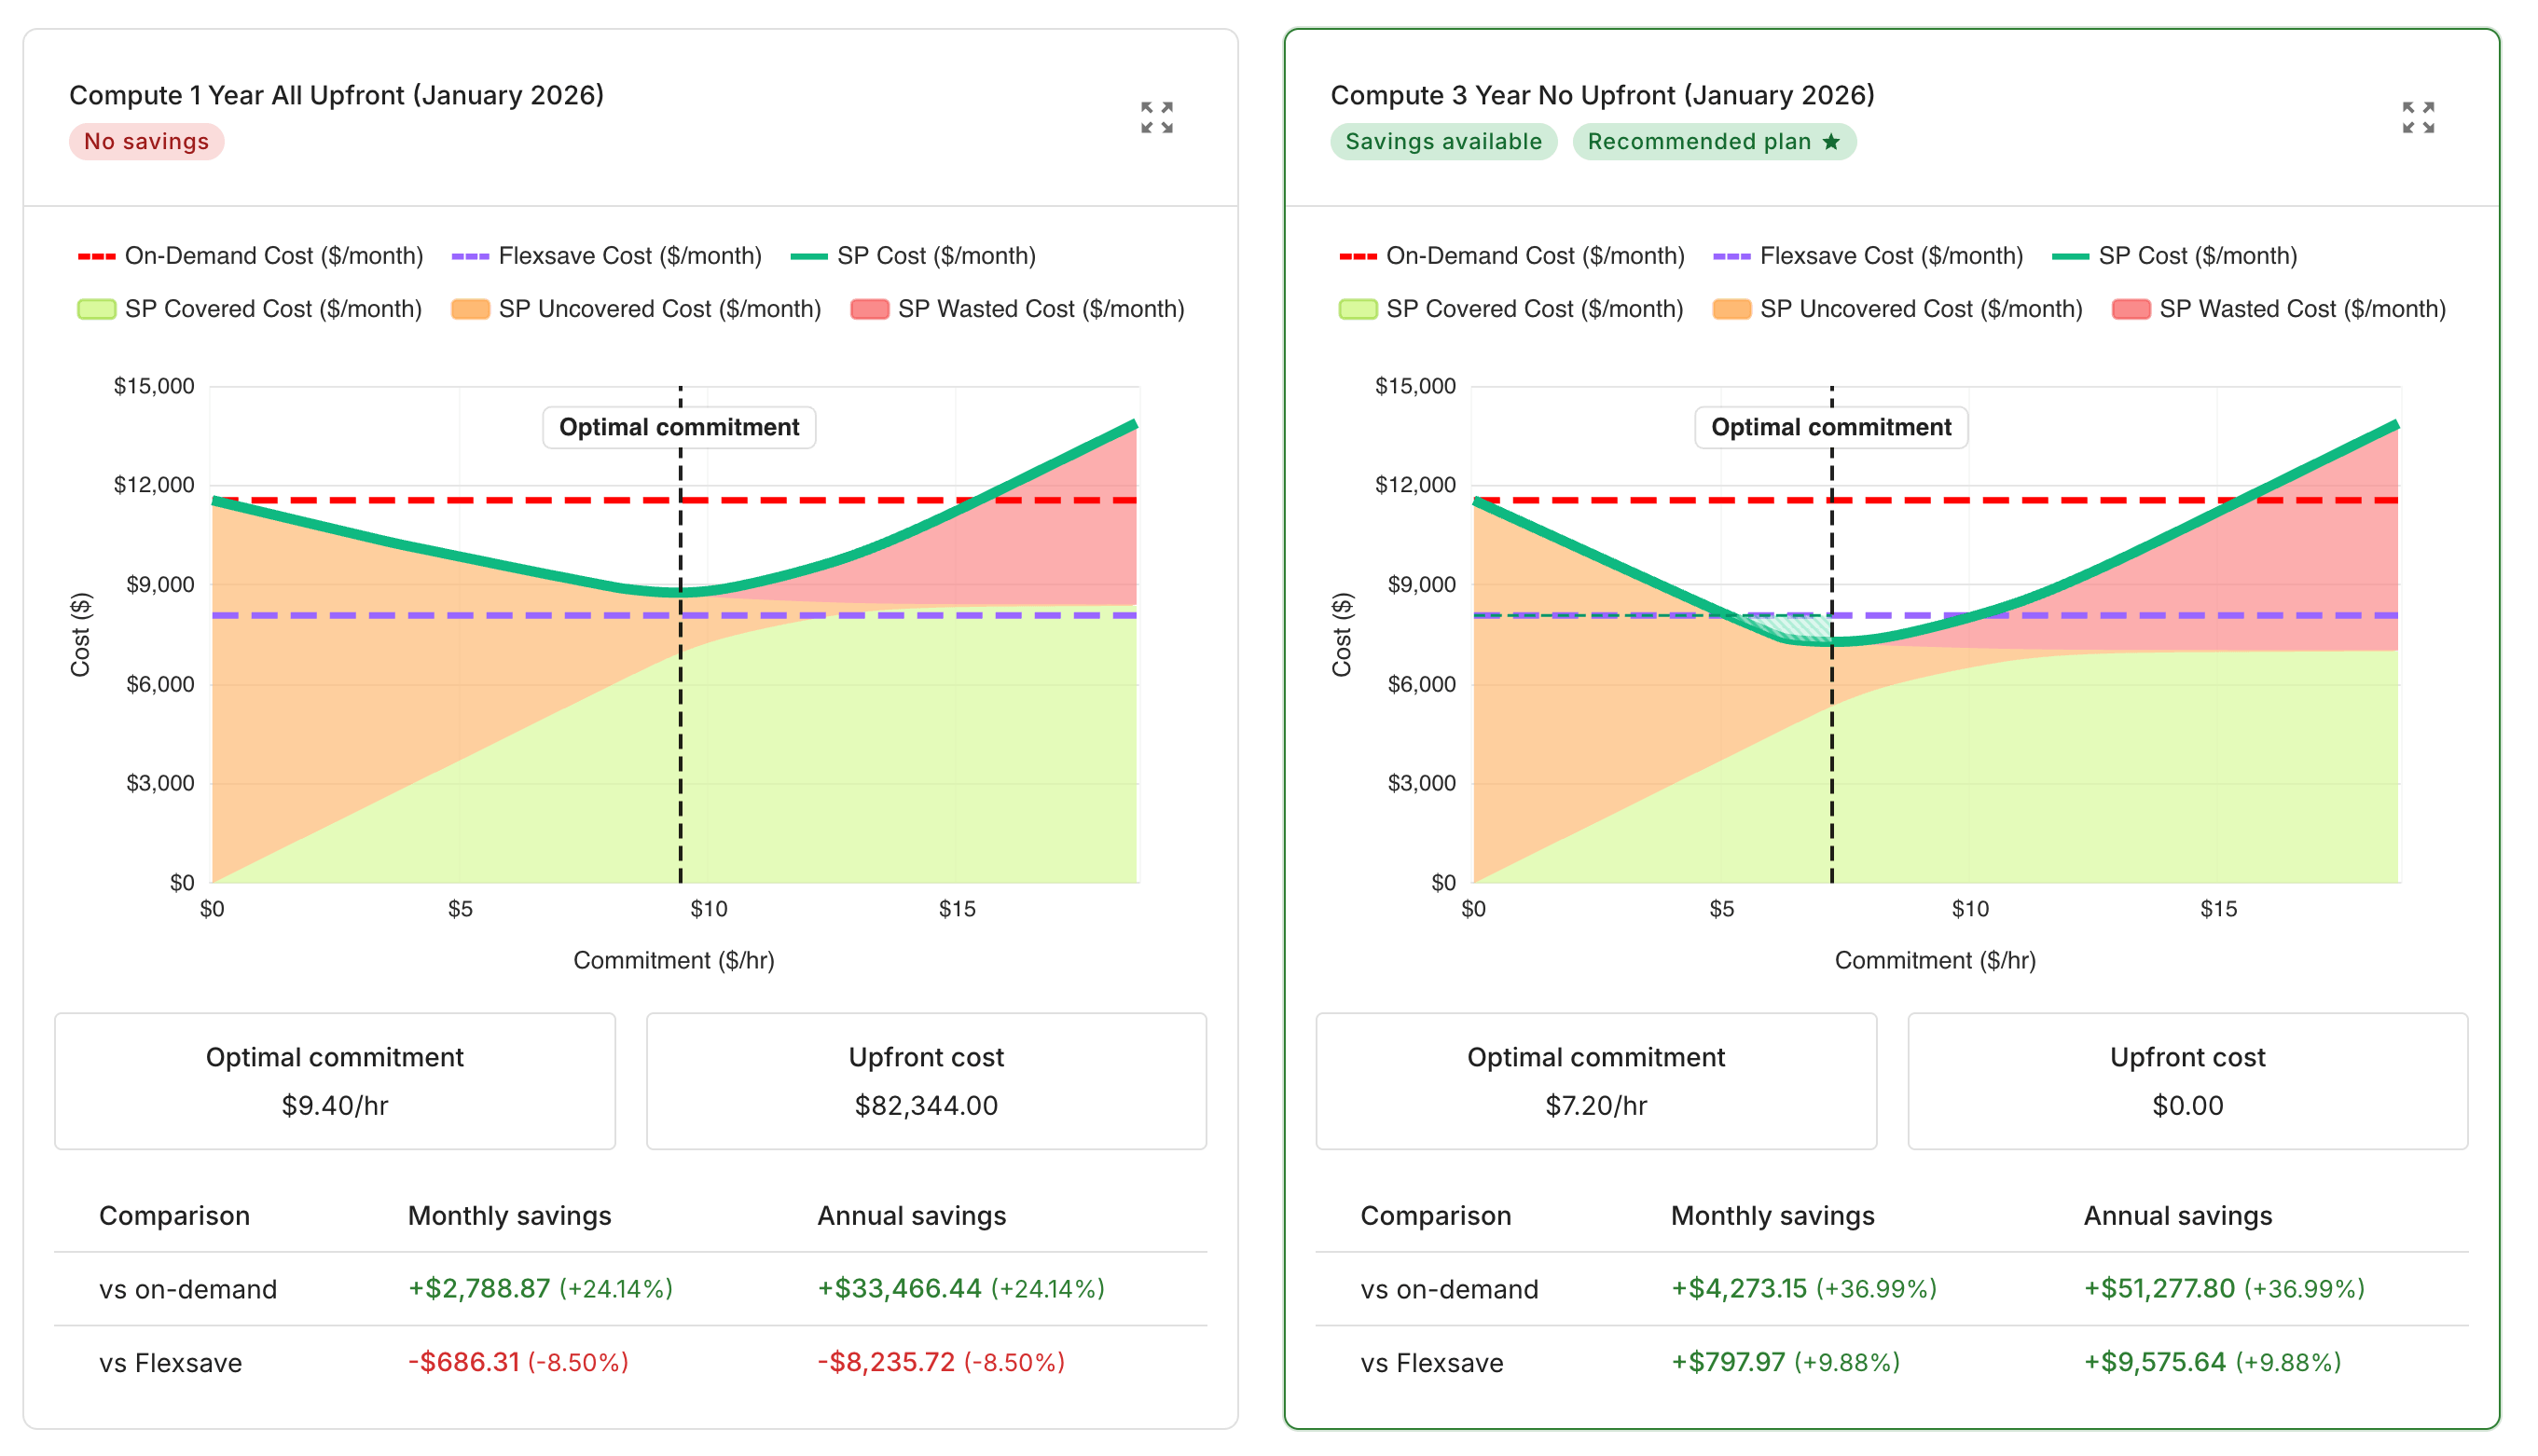
The cost curve: the green line (SP Cost) drops as commitment increases, bottoms out at the optimal point, then rises as waste accumulates.
| Dimension | AWS Purchase Analyzer | DoiT Commitment Simulator |
|---|---|---|
| Input model | You set the goal (coverage %, custom amount, or recommended) | Simulates all possible amounts automatically |
| Output | Single recommendation with savings/coverage/utilization metrics | Full cost curve showing optimal point and tradeoff at every level |
| Key insight | "How much to buy to hit X% coverage" | "Where does overcommitment begin, and where is the sweet spot" |
| Optimization target | Coverage percentage or savings maximization | Total cost minimization (lowest SP Cost) |
| Risk visualization | Utilization tab shows how much goes unused | Wasted bucket shows dollar cost of overcommitment at each level |
| Cloud support | AWS only | AWS (Compute, Machine Learning, Database SPs) and GCP Spend-Based CUDs |
| Lookback period | Up to 60 days | Full month of billing data |
| Scope | Per SP type (Compute, EC2 Instance, Database, SageMaker AI) | Per SP type (Compute, Machine Learning, Database) |
| Pricing | Free (native AWS tool) | Included with DoiT Cloud Intelligence |
The key philosophical difference: the AWS tool lets you say "I want 75% coverage" and tells you the cost. The DoiT simulator shows you that maybe 68% is where the steep part of the savings curve flattens, and the last 7 points toward 75% buy diminishing returns at increasing waste risk. The docs describe this as finding the "ceiling to stay below, not a number to commit to."
With the target coverage feature now available, a natural workflow emerges: use the DoiT Commitment Simulator to understand the shape of the cost curve and identify the optimal zone, then use the AWS Purchase Analyzer to validate a specific commitment amount within that zone against the latest usage data before adding it to cart.
Where DoiT PerfectScale for Commitments Takes Over
The Commitment Simulator is a planning tool. It tells you where the optimal zone is. DoiT PerfectScale for Commitments goes further by automating the execution.
PerfectScale for Commitments is a commitment management feature that helps you evaluate your current commitments, plan new ones, and optionally automate the purchasing process. The core concept is commitment laddering: instead of buying a large block of Savings Plans once per quarter, PerfectScale automatically purchases incremental commitments over time, buying smaller amounts to reduce the risk of over-commitment and adjusting to actual usage. Purchases are typically scheduled within the first 20 days of the month, giving you a window to review and cancel before execution.
This is the conversation I now have with customers instead of the one I described at the beginning of this post: we review the cost curve together, identify the sweet spot where most savings are captured without significant waste risk, and the customer sees exactly what they are committing to before a single dollar is spent.
NOTE: PerfectScale for Commitments purchases commitments in your cloud provider account. You own the commitments and carry unused commitment risk. This is different from DoiT's Flexsave for Compute, where DoiT holds the commitments and carries that risk on your behalf.
The combination of the two tools covers the full workflow: AWS Purchase Analyzer for one-time analysis and ad-hoc modeling, PerfectScale for Commitments for ongoing autonomous execution with guardrails.
Practical Considerations and Caveats
A few things worth knowing before changing your purchasing strategy based on target coverage analysis:
Not all instances are eligible for Savings Plans coverage. This is the single most common source of confusion I see with customers. They run dozens of instances 24/7 and wonder why the recommended commitment is lower than expected. The reason: older instance generations and certain instance types are not eligible for Savings Plans discounts. If you have instances on legacy generations (C4, M4, R4, etc.), they will not be covered regardless of how much you commit. Before purchasing, check which instance families are eligible using the Compute Savings Plans pricing page. If you have a significant fleet on ineligible instance types, the highest-ROI action is to modernize those instances to current generations (C7i, M7i, R7i, etc.) first. You get better performance, lower per-hour cost, AND the instances become eligible for Savings Plans coverage. Always modernize before committing.
Coverage percentage is not the same across Savings Plans types. Compute Savings Plans coverage is measured against eligible compute spend (EC2, Lambda, Fargate). EC2 Instance Savings Plans only cover specific instance families in specific regions. When your finance team says "70% coverage," confirm whether they mean coverage of total eligible compute, or of EC2-only spend, or of all On-Demand. The analyzer reflects whichever dimension you select, but the denominator matters.
The lookback period affects the recommendation significantly. A 7-day lookback captures recent usage shifts but is noisy. A 60-day lookback is smoother but lags behind workload growth. For most customers, a 30-day lookback with the target coverage feature is the right starting point, but if your team just completed a migration or a major new service launch, override to a shorter window that better reflects your new steady state.
Reserved Instances and Savings Plans interact. If you have existing EC2 Reserved Instances, they cover usage before Savings Plans apply. The analyzer accounts for this in its coverage calculation, but it is worth confirming in the Coverage report that your RIs are showing up correctly as covered hours.
The analyzer does not purchase for you. After generating the recommendation, you still click through a confirmation flow that shows the total commitment amount, the estimated monthly savings, and the payment. This is by design. Do not skip reading this screen.
Conclusion
The target coverage analysis update to the AWS Savings Plans Purchase Analyzer closes a real gap in the native tooling. For the first time, you can start with an organizational coverage goal and work backward to a commitment amount, rather than starting with a commitment amount and hoping the coverage falls where you need it.
The workflow I would recommend to any FinOps team today: use target coverage analysis quarterly to model your purchasing needs, account for expiring plans explicitly, and use DoiT PerfectScale for Commitments to automate the ongoing laddering between those quarterly reviews. The two tools answer different questions and work well together.
NOTE: PerfectScale for Commitments and Commitment Simulator are only available to DoiT customers.
Key Takeaways:
- Target coverage analysis lets you set a coverage percentage goal and get a commitment recommendation to hit it, rather than optimizing for savings rate by default
- Exclude expiring plans when running the analysis to account for the coverage gap those plans leave when they roll off
- Coverage and utilization trade off against each other for variable workloads: higher coverage requires a larger commitment relative to your baseline, which lowers utilization
- DoiT PerfectScale for Commitments automates the laddering (incremental purchasing over time) and provides a Commitment Simulator that shows the full savings-vs-waste tradeoff at every commitment level