AWS FinOps Agent Preview: What It Can Actually Do (and Where You Still Need a Human)
AWS FinOps Agent automates the investigation gap between "anomaly detected" and "what caused it." Here's how the flow works, where the conversational interface adds value, and an honest look at where you still need a human or a multi-cloud tool like DoiT.
One of the most common pain points I hear from FinOps practitioners at DoiT is the investigation gap: AWS Cost Anomaly Detection tells you a spike happened, but it does not tell you who caused it or why. Closing that gap requires opening Athena, writing a query against your CloudTrail logs, correlating the results against your resource inventory, and writing a summary. For a team triaging three or four anomalies per week, that is several hours of largely mechanical work.
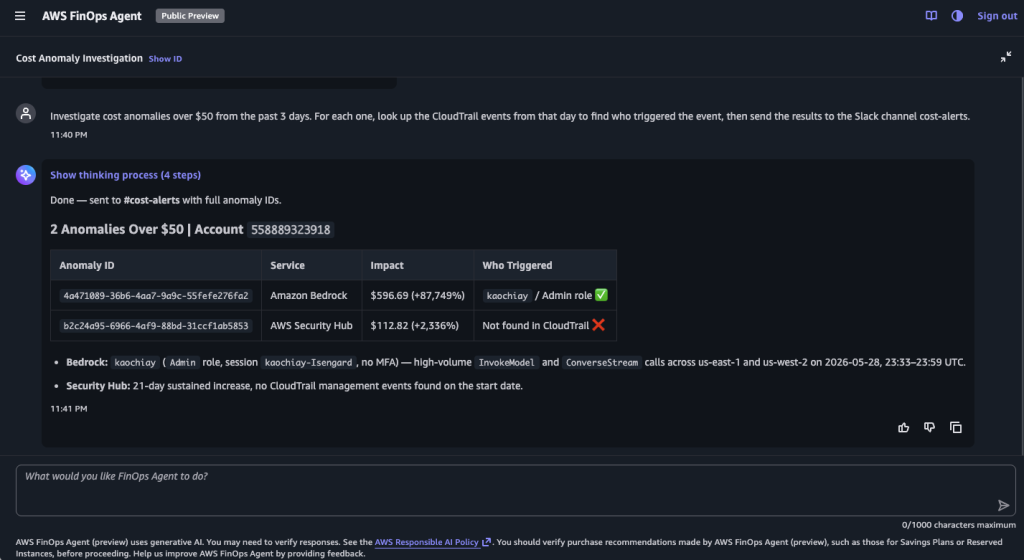
The AWS FinOps Agent, announced in public preview on June 9, 2026, is designed to automate exactly that step. Based on AWS's documented capabilities and my setup of the preview, here is what the investigation output is designed to produce for a Bedrock cost anomaly:
"Investigated the cost anomaly detected at 14:23 UTC. Root cause: the rolearn:aws:iam::123456789012:role/bedrock-eval-runnermade a high volume ofInvokeModelcalls between 13:45 and 14:22 UTC. This correlates with CloudTrail events from the same role. The tagteam:platformis associated with this role. Estimated excess spend: above the configured threshold."
No human wrote that. The agent produces it automatically in response to a Cost Anomaly Detection event. That is the pitch, and for that specific use case, the documented architecture supports it.
What the AWS FinOps Agent Is
AWS FinOps Agent (currently in public preview, available at no charge subject to a monthly usage limit) is a frontier AI agent that connects to your cost data and operates autonomously across several capability areas. It runs on Amazon Bedrock, which also provides the automated abuse-detection guardrails that keep the agent's behavior in scope. The AWS FinOps Agent features page describes how to use it:
Anomaly investigation and routing. When Cost Anomaly Detection fires an alert, the FinOps Agent automatically investigates. It correlates the cost spike with AWS CloudTrail events to identify the change that drove it and produces an investigation summary with the likely root cause and the responsible owner. You can filter by threshold so the agent only fires on anomalies that matter. Optionally, you can route findings to Slack or Jira so the right person gets the context without opening the AWS console.
Cost answers for engineers. Anyone on your team can ask cost questions in natural language. "What was our EC2 spend in us-east-1 last week, broken down by instance family?" or "Which IAM roles drove the highest Bedrock costs this month?" The agent queries your actual cost and usage data and returns a structured answer. It supports context files (account-to-owner mappings, tagging conventions) so it can resolve questions in your organization's terms, and it remembers preferences across sessions.
Reporting, optimization, and recurring workflows. You can schedule recurring cost reports (daily, weekly, monthly) in downloadable, presentation-ready formats (HTML, PDF, PPT) - the HTML output renders as a polished, dashboard-style summary rather than a raw table. The agent also pulls recommendations from AWS Cost Optimization Hub and Compute Optimizer and summarizes them for review. Any recurring task can be defined in natural language and the agent runs it on schedule. If you connect Jira, it can push optimization summaries as tickets directly to the engineering teams that own the affected resources.
All results are available directly in the agent's web application within the AWS console. Optionally, you can connect Slack or Jira to have findings delivered to your team's existing workflows.
Setting Up the FinOps Agent
Prerequisites: The agent requires Cost Anomaly Detection monitors to be configured (for anomaly investigation) and CloudTrail Event History enabled (it is enabled by default in every AWS account). The agent queries cost data through AWS Cost Explorer APIs and correlates it with CloudTrail LookupEvents. It is available in US East (N. Virginia) only during preview.
Setup takes just a few minutes.
Step 1: Enable the agent. Open the AWS FinOps Agent console in us-east-1 and choose Create. The creation wizard walks through five steps: name your agent; choose what AWS resources the agent can access (the agent role that reads your cost and usage data); give the web app access (the operator role that backs the chat interface); connect Jira or Slack (optional); and review and create. The wizard can auto-create both IAM roles for you. Worth noting for anyone vetting the agent: both roles are built around reading your cost and usage data. The only changes the agent makes on your behalf are the EventBridge rules it provisions for anomaly automations (scoped so it can manage only the rules it created), and the Jira tickets or Slack messages it posts once you connect those integrations - and every one of those actions lands in CloudTrail.
Step 2: Configure your Cost Anomaly Detection monitors. If you do not already have monitors configured, create at least one at the account or service level. A detected anomaly is the trigger for the autonomous investigation workflow - the FinOps Agent listens for Cost Anomaly Detection events through Amazon EventBridge automatically once you configure an event-triggered automation. The SNS subscriber in the example below is standard Cost Anomaly Detection alerting (email/SNS notifications); it is not the channel the agent listens on, but you typically want monitors and a subscription configured either way.
# Create a Cost Anomaly Detection monitor for all services
aws ce create-anomaly-monitor \
  --anomaly-monitor '{
    "MonitorName": "AllServicesMonitor",
    "MonitorType": "DIMENSIONAL",
    "MonitorDimension": "SERVICE"
  }'

# Create a subscription with an SNS notification
aws ce create-anomaly-subscription \
  --anomaly-subscription '{
    "SubscriptionName": "FinOpsAgentSubscription",
    "MonitorArnList": ["arn:aws:ce::123456789012:anomalymonitor/MONITOR_ID"],
    "Subscribers": [
      {
        "Address": "arn:aws:sns:us-east-1:123456789012:FinOpsAgentTopic",
        "Type": "SNS"
      }
    ],
    "Frequency": "IMMEDIATE",
    "ThresholdExpression": {
      "Dimensions": {
        "Key": "ANOMALY_TOTAL_IMPACT_ABSOLUTE",
        "MatchOptions": ["GREATER_THAN_OR_EQUAL"],
        "Values": ["20"]
      }
    }
  }'
Step 3 (optional): Connect Slack or Jira. If you want findings delivered outside the AWS console, open the agent detail page and choose Add connection. This is not required. All investigation summaries, reports, and query results are accessible directly in the agent's web application. The integrations just push them to where your team already works.
One setup gotcha worth knowing for Slack: create the target channel first, and add the FinOps Agent Slack app as a member of that channel before configuring the integration. The connection will not post until the app is in the channel, and the wizard does not flag this for you upfront - early hands-on reports hit this exact snag. Once the app is a channel member, it works as expected.
Once connected, you can instruct the agent in natural language: "When you detect a cost anomaly above $100, post your investigation summary to #finops-anomalies." The agent interprets this as a standing automation and operates autonomously from that point.
How the Investigation Flow Works
AWS documents the agent's investigation workflow as follows when a Cost Anomaly Detection event fires:
- Cost Anomaly Detection flags an anomaly: a service's spend has exceeded the configured threshold relative to the expected baseline.
- The FinOps Agent receives the EventBridge event and begins its investigation. It queries AWS Cost Explorer for the anomaly window to identify the specific services and usage changes driving the spike.
- It cross-references the cost change with CloudTrail Event History, searching for API activity correlated with the anomaly window to identify what changed and who made the change.
- The agent generates a structured investigation summary with the likely root cause and the responsible owner.
- The investigation summary appears in the agent's web application. If you have configured Slack or Jira integrations, it also posts to the channel or creates a ticket based on your automation rules.
The agent runs this end-to-end investigation autonomously. The accuracy depends heavily on CloudTrail coverage and resource tagging quality in your account, both of which are prerequisites worth investing in before deploying the agent.
NOTE: The documentation describes two investigation depths depending on IAM permissions. With Cost Explorer only, the agent provides anomaly details with affected services, accounts, cost impact, trends, and rate-vs-usage analysis. With Cost Explorer and CloudTrail, the agent adds a search of CloudTrail Event History for API activity correlated with the cost change. The agent's documented mechanism for mapping a finding to a responsible team is the context files you upload (account-to-owner mappings, team definitions). Tagging your IAM roles with team ownership is a useful complement, giving the agent another signal to connect a role ARN surfaced in CloudTrail to a team.
Conversational Queries: What Works and What Does Not
Beyond anomaly investigation, the conversational interface is useful for ad-hoc cost questions from engineers and team leads who do not want to open Athena or Cost Explorer.
Questions that work well:
- "What are the top 5 services by spend in us-east-1 this month compared to last month?"
- "Show me untagged EC2 instances that ran last week."
- "Which IAM roles had the highest Bedrock inference costs in the past 30 days?"
- "What is our current Savings Plans coverage percentage for compute?"
Questions where it struggles:
- Complex multi-dimensional analysis requiring custom aggregations that do not map to standard CUR columns
- "What caused our costs to increase by 23% year over year?" requires context that the agent does not have (organizational changes, new products, seasonal patterns)
- Anything requiring comparison to a budget or forecast that lives outside of AWS (in a spreadsheet, in your ERP system, in DoiT Cloud Intelligence)
- Questions that need current-state infrastructure context, not historical cost data: "Is this instance still running?" is not a cost question, it is an inventory question
The documentation states that the agent is constrained to the FinOps domain and does not generate answers outside it (a behavioral guardrail). For questions requiring forward-looking projections or data outside of Cost Explorer and CloudTrail, the agent works with what it has: Cost Explorer's forecast APIs for projections, and the cost data sources it can access. That kind of bounded scope is more useful than an agent that confidently returns a wrong answer.
One language caveat for non-English teams: in the early preview, the agent responds only in English. This is a current-state constraint rather than a fixed limitation - language coverage is exactly the kind of thing that tends to broaden as a preview matures toward general availability, so it is worth rechecking before you rule the agent out on that basis.
How It Compares to Existing Tools
The question I get from most customers is: "We already have Cost Anomaly Detection and Athena queries for investigations. What does the agent add?"
The honest answer: the agent adds the investigation step itself. Cost Anomaly Detection tells you something happened. The agent tells you what specifically happened and who caused it. That step currently requires a human to open Athena, write a query against CloudTrail logs, correlate the results, and write a summary. The agent automates that entire workflow.
NOTE: The FinOps Agent uses CloudTrail Event History (cloudtrail:LookupEvents) for its investigation, which is free and enabled by default in every AWS account. It does not use CloudTrail Lake. If your team previously relied on CloudTrail Lake for SQL-based manual investigations, note that Lake is no longer open to new customers as of May 31, 2026. Existing customers can continue using it, but new accounts should query CloudTrail logs via Amazon Athena or let the FinOps Agent handle the correlation automatically.
Where DoiT Goes Deeper
Where the AWS FinOps Agent provides a solid first-responder capability for anomalies (including cross-account visibility when deployed in the management account), DoiT's real-time anomaly detection operates at a fundamentally different level. The key differences:
- Multi-cloud and multi-platform visibility. DoiT monitors cost anomalies across AWS, Google Cloud, Azure, Snowflake, Databricks, Datadog, OpenAI, and more from a single pane. If a cost spike involves services across cloud providers, you see it in one place.
- SKU-level precision with allocation-based routing. DoiT's anomaly detection works primarily at the SKU level for billing data. You can route notifications from specific allocations (custom resource groups) to separate channels, reducing noise and ensuring the right team gets the right alert.
- Real-time detection for key services. For EC2, RDS, GCE, and BigQuery, DoiT offers near real-time anomaly detection based on usage data derived from CloudTrail/Audit Logs, reporting anomalies within an hour of usage rather than waiting for billing data (which can take up to 12 hours). On AWS specifically, this goes below the service line: RDS, for example, is broken out into DB-instance hours, provisioned storage (per GB-month), and provisioned IOPS, so a spike is attributed to the component driving it.
- Built-in AI investigation. Each anomaly includes contributory resources with labels/tags and an AI analysis feature that explains the anomaly and suggests remediation, without writing a single query.
- Conversational AI across all three clouds. The FinOps Agent's two headline features - natural-language cost queries and AI anomaly investigation - have a direct multi-cloud counterpart in Ava, DoiT's AI assistant. You can ask Ava about your spend for any period and get an instant Cloud Analytics report you keep refining in conversation, scope it to individual AWS accounts, and have it produce a detailed explanation and summary of any detected cost anomaly - across AWS, Google Cloud, and Azure, not just AWS.
The right posture during preview is to run both: use the FinOps Agent for fast automated triage of anomalies within AWS, and leverage DoiT's anomaly detection for multi-cloud visibility, SKU-level precision, and real-time detection that the native agent cannot yet provide.
Practical Recommendations
If you are going to deploy this during preview, a few recommendations based on the testing:
Set a minimum anomaly threshold before the agent fires. A $10 anomaly does not need a full investigation cycle. Set your Cost Anomaly Detection subscription threshold at $50 to $100, depending on your account size, so the agent focuses on meaningful events.
Invest in IAM role tagging early. An investigation output is only actionable if you can map a role ARN to a team or an application, and the agent does that primarily from the context files you upload (see below). A tagging convention like team:, application:, and environment: on all IAM roles takes an afternoon to implement and gives the agent an additional signal to attribute the role ARNs that surface in CloudTrail.
Upload context files to the agent. The FinOps Agent supports organization-specific context files: account-to-owner mappings, team definitions, tagging conventions, and custom instructions. Upload a CSV that maps your account IDs to team names and leads, and the agent immediately attributes spend and anomalies to the right team without you having to manually interpret role ARNs. This is the single highest-leverage configuration step after enabling the agent.
Route findings to where your team works (optional). If you connect Slack, a dedicated channel like #finops-anomalies keeps automated summaries separate from human conversation. If you connect Jira, the agent can create tickets for anomalies or optimization recommendations. Neither is required; the agent's web application is the primary interface for all results.
Review agent findings regularly at first. The agent's CloudTrail correlation is designed to identify the most likely root cause, but like any automated triage, it can miss context a human would catch: a planned load test, a recently deployed feature, or a known usage spike tied to a business event. Have someone review each investigation summary during your first month to build confidence in when to trust the output directly and when to investigate further.
Conclusion
AWS FinOps Agent automates the most tedious part of FinOps: the manual investigation that sits between "an anomaly was detected" and "we know what caused it and who owns it." For teams currently triaging cost anomalies manually, that is meaningful time savings.
It is not a full FinOps platform replacement, and it does not yet match the breadth of multi-cloud, SKU-level anomaly detection available through tools like DoiT Cloud Intelligence. But as a first responder for cost anomalies within AWS, it is genuinely useful, and the conversational interface lowers the barrier for engineers to answer their own cost questions without involving a FinOps specialist.
The agent itself is free during preview, subject to a monthly usage limit (you pay only the standard per-request rate for the underlying AWS APIs it calls on your behalf, such as Cost Explorer). If you already have Cost Anomaly Detection configured, you can be up and running quickly. Try it.
Key Takeaways:
- AWS FinOps Agent automatically investigates cost anomalies by correlating Cost Explorer data with CloudTrail Event History, producing a root cause summary autonomously
- CloudTrail Event History (free, enabled by default) is what the agent uses for investigation. It does not require CloudTrail Lake or a custom trail.
- DoiT's anomaly detection provides multi-cloud coverage, SKU-level precision, and real-time detection that complements the FinOps Agent's AWS-only scope
- Available at no charge during preview (subject to a monthly usage limit) in US East (N. Virginia); configure a meaningful anomaly threshold to avoid noise from small fluctuations